
Internal resistance is one of a few key characteristics that define a lithium ion cell’s performance. A cell’s power density, dissipation, efficiency, and state of health (SoH) all depend on its internal resistance. However, a cell’s internal resistance is anything but a single, unvarying value. It has a complex frequency-dependent nature that relates to specific electronic and ionic attributes within the cell. Further, it is dependent on the cell’s temperature, state of charge (SoC), size, chemical makeup, construction, and age. The state of the cell and test conditions need to be explicitly set to have results that are relevant and comparable.
The most common methodologies for measuring a cell’s internal resistance include electrochemical impedance spectroscopy (EIS), alternating current internal resistance (AC-IR), and direct current internal resistance (DC-IR). Each of these are uniquely different making them particularly useful in certain applications while not being well suited for others. Let’s find out why!
Electrochemical impedance spectroscopy (EIS) Measurement:
Let’s start with electrochemical impedance spectroscopy (EIS), because far more so than any of the other measurement methodologies, EIS provides the most complete insight into the cell’s dynamic impedance characteristics, making it a favored choice among battery researchers. EIS measurements are traditionally made using a potentiostat/galvanostat instrument that applies a small signal AC current or voltage stimulus over a wide range of test frequencies, typically spanning from as low as a millihertz to as high as a megahertz. It then measures the resultant voltage or current response and uses digital signal processing to determine the complex impedance values at the given test frequencies. Results are typically displayed as a Nyquist plot, having characteristics that relate to physical phenomena within the battery that researchers readily recognize. An illustration of such a Nyquist plot for a lithium ion cell is shown in Figure 1.

Figure 1: Lithium ion cell EIS Nyquist impedance plot
A cell’s equivalent electrical circuit model (ECM) can be derived from the Nyquist plot of the EIS measurement. ECMs are a popular way to model the electrical behavior of cells as they are mathematically relatively easy to implement and relate back to physical attributes of the cell. A basic ECM network is depicted in Figure 2.
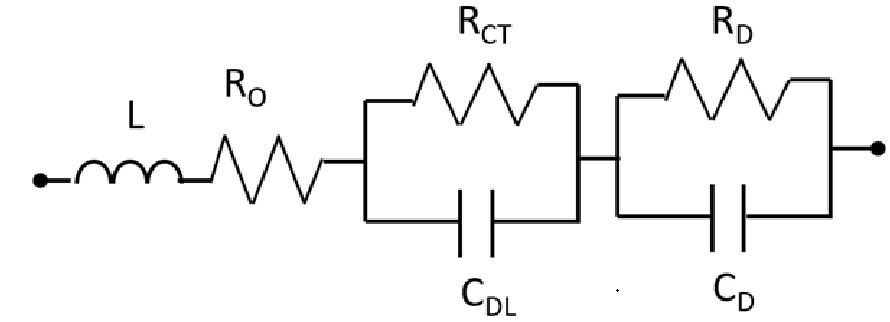
Figure 2: Lithium ion cell ECM
Elements of the ECM include:
• The cell’s inductance L and ohmic resistance RO. Most of RO is electrolyte bulk resistance. These dominate at high frequencies at many 100’s of Hz and above.
• The double layer capacitance CDL and the charge transfer resistance RCT. These dominate at mid frequencies typically in the range of 1 to 10 Hz.
• Resistance RD and capacitance CD are associated with the slow kinetics of the ion diffusion process. These dominate below typically about 1 Hz.
The frequencies are very approximate for lithium ion cells of a few amp hours (Ah) to 10’s of Ah in capacity, as they depend largely on the size of the cell, as well as other cell attributes.
While EIS measurements provide the most insight into a cell’s impedance characteristics, it also poses some challenges, including:
• A potentiostat/galvanostat set up is typically expensive.
• It often requires a high level of competency on the part of the user to set up and operate.
• The measurement is increasingly time-consuming, especially as one goes lower in test frequency.
• It is increasingly difficult to accurately measure the extremely low impedances as cells become larger.
Given the insights provided, EIS is a key choice for making cell impedance measurements in R&D. Given the complexity, it is usually limited to use in R&D. One example of where Keysight provides EIS measurement capabilities is in our Scienlab SL100xA series battery test systems for cell level testing, shown in Figure 3. Click on “Scienlab battery test systems” to learn more about these systems for cell research.
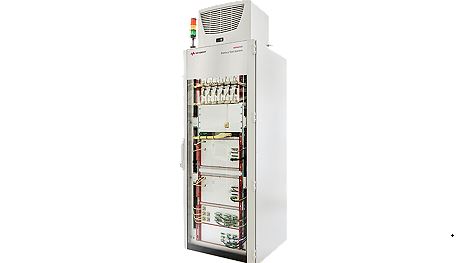
Figure 3: Scienlab SL100xA series battery test system
Alternating Current Internal Resistance (AC-IR) Measurement:
AC-IR is a basic small-signal AC-stimulus measurement method that is used extensively in manufacturing as it is simple to implement, the equipment is relatively inexpensive, and can be quickly done for the cells on a 100% basis. The 1 kHz AC-IR measurement is a widely recognized de-facto standard for internal resistance, being carried over from traditional lead-acid battery testing. For lithium ion cells of a few Ah to a few tens of Ah of capacity, a 1 kHz AC-IR measurement will provide a fair estimation of the cell’s ohmic resistance, RO. While having a measurement of the ohmic resistance is useful, it does not provide a complete enough picture for the purposes of ascertaining the performance of a lithium ion cell that relies on the total internal resistance as a key characteristic. To further supplement this then, a second, 1 Hz low frequency AC-IR measurement is often made to estimate the series combination of RO and charge transfer resistance, RCT, as shown in Figure 1. Based on already estimating what RO is from the 1kHz AC-IR measurement, RCT can now be estimated. Accuracy of results depend on how close the test frequencies correlate to the actual inflection-point frequencies for RO and RO + RCT, in Figure 1.
Direct Current Internal Resistance (DC-IR) Measurement:
In contrast to EIS and AC-IR measurements, DC-IR is a large-signal DC-stimulus measurement methodology. It is also often referred to as pulsed power testing or pulsed current testing. DC-IR measurements are relatively quick to perform, but requires high power, high current equipment with low resistance connections to the cells. This makes DC-IR measurement best suited for use in R&D, using a test system like that pictured in Figure 3. It is also often performed in manufacturing on a sample basis, using a dedicated station, as was discussed in an earlier blog posting, “The ABCs of Lithium Ion Cell Manufacturing” (click on the title to learn more).
For performing DC-IR testing a large current step or pulse is applied, and the resulting voltage response is measured, as depicted in Figure 4. The pulse amplitude may be up to as high as 20C, which is 20 times the amp-hour rating of the cell, in amperes. At these large of amplitudes, the pulse duration is limited to typically no more than 18 to 20 seconds as defined in existing standards, or what the manufacturer defines is the maximum pulse limit for their cells. Due to being a large-signal measurement methodology, problems with the cells may be revealed which may have otherwise gone undetected using small-signal testing of the previous two methodologies described.
Different portions of the measured voltage response shown in Figure 4 are associated with the different resistances making up the total internal resistance:
• The initial voltage drop at the step edge of the applied stimulus current is attributed to the cell’s ohmic resistance, RO.
• The additional voltage-drop for approximately the first second after the initial step edge drop is attributed to the cell’s charge transfer resistance, RCT.
• The nearly linear-appearing decay rate of voltage-drop beyond one second is attributed to the cell’s diffusion resistance, RD. However, additional voltage decay due to discharging the cell can be significant at longer durations, leading to a higher-than-expected estimation of the value of RD.
Like AC-IR measurements, some assumptions are made on the appropriate duration of time of when to measure the voltage drops for determining RO, RCT and RD. Common practice is to use 0.1 seconds, 1 second, and 10 seconds for determining these resistance values. Just as with AC-IR measurements, measurement accuracy depends on how well these durations correspond to the actual inflection-point frequencies for RO and RO + RCT in Figure 1.
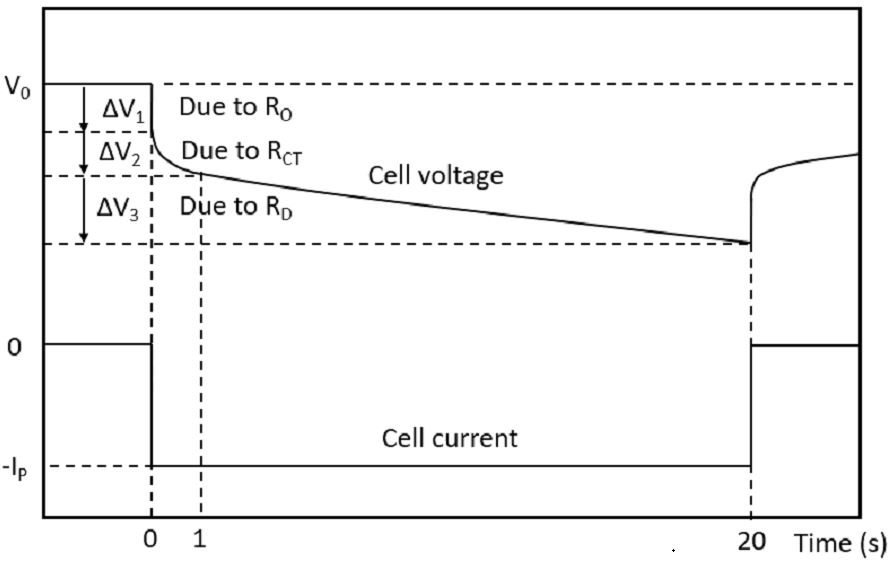
Figure 4: Cell DC-IR measurement.
Experimental Results:
EIS, AC-IR, and DC-IR measurements were performed on a 25 Ah lithium ion pouch cell to compare the results of each method. The real (resistive) portion of the measurement for each method was plotted, using the frequency for the EIS measurement, and the inverse of the duration of the DC pulse, for the DC-IR method, was used for comparison. EIS measurements were taken from 0.05 Hz to 500 Hz, an AC-IR measurement was taken at 1 kHz, and a DC-IR measurements were taken from 20 seconds to 2 milliseconds. The results are plotted in Figure 5.
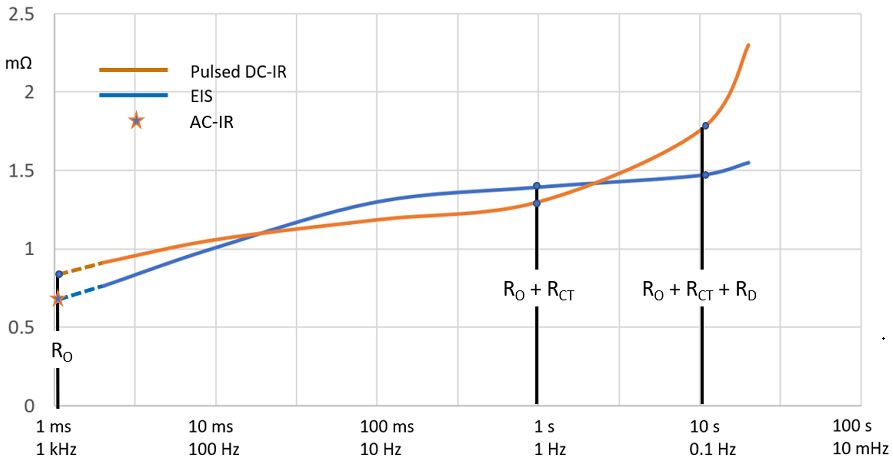
Figure 5: Internal resistance measurements versus frequency/time duration
Not surprising, the AC-IR aligned with the projection of EIS measurements to 1 kHz, due to similarity in measurement methods. Overall, it was found that results between EIS and DC-IP correlated well up to about 0.3 Hz/3.3 seconds duration, providing good estimates for RO and RCT values using either method. Above this point however, the DC-IR measurement rapidly increased in comparison to the EIS measurement value for internal resistance. For the experimental test results, at 0.1Hz/10 seconds the DC-IR method yields a 20% increase in overall resistance but a 5-fold increase in estimation of just the diffusion resistance, RD. This increase in measured resistance is attributed to the cell voltage dropping due to loss of charge, in addition to voltage drop due to the cell’s internal resistance. The DC-IR measurement continued to increasingly diverge with lower frequency/time duration.
In Closing:
Internal resistance is one of a few key characteristics that define a lithium ion cell’s performance and hence that is why it is tested extensively both in development and manufacturing. A cell’s internal resistance is not a fixed value; it increases with lower frequency or longer load duration due to additional resistive elements due to electrochemical and ionic mechanisms in the cell. Furthermore, it also varies with temperature, state of charge (SoC), size, chemical makeup, and age.
Due to the complexities of a cell’s internal resistance, various measurement methods exist to address specific needs in R&D and in manufacturing. Top methods discussed here are:
• Electrochemical impedance spectroscopy, or EIS, is a small signal AC stimulus method that measures the cell’s complex impedance over a wide span of test frequencies. As it provides the most complete insight into the cell’s dynamic impedance characteristics, it favored in R&D.
• AC internal resistance, or AC-IR, is a small signal AC stimulus method that measures the cell’s internal resistance at a specific frequency, traditionally 1 kHz. For lithium ion cells, a second, low frequency test point may be used to get a more complete picture of the cell’s internal resistance. This is favored in manufacturing due to its relative simplicity and speed.
• DC internal resistance, or DC-IR, is a large signal method that uses a high current DC pulse stimulus to measure a cell’s internal resistance. The duration of the pulse can be related to the inverse of the test frequency used in AC measurement methods, up to the point where cell discharge starts becoming significant, as was shown here. As large signal testing may reveal things that small signal testing does not, the DC-IR method is used in both R&D, and also manufacturing on a sample basis.
It was experimentally demonstrated here that reasonable correlation can be drawn between the small signal AC measurement methods and the large signal DC-IR method, but only up to a limited duration of a few seconds. Beyond that the DC-IR method may be more appropriately referred to as a pulsed-power method, due to significant cell discharge contributing additional voltage drop, causing a higher than actual resistance value.
If you found this informative, continue to look for additional articles on lithium ion cell formation and test here, and how Keysight may be able to help you with your needs!


